


- Energy Storage Solutions
- U.S. Renewable Energy Market
U.S. Renewable Energy Market Size, Share, and Growth Forecast 2026 - 2033
U.S. Renewable Energy Market by Source (Wind, Solar, Hydropower, Bioenergy, Others), Application (Industrial & Utilities, Commercial, Residential), Analysis, 2026 - 2033
U.S. Renewable Energy Market Size and Trend Analysis
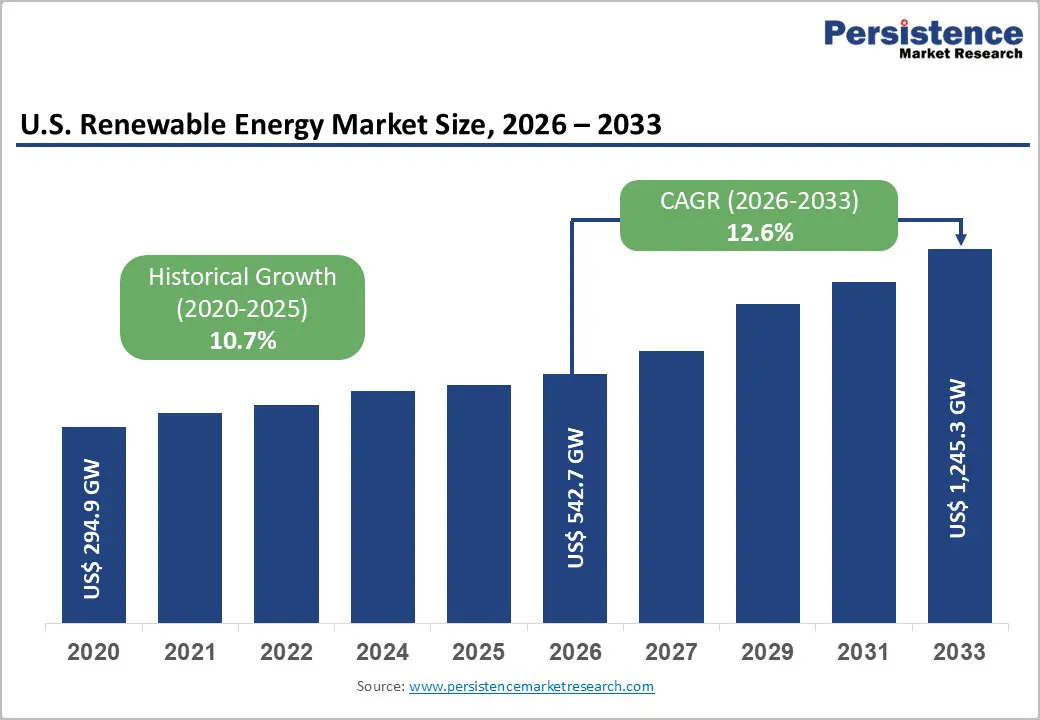
The U.S. renewable energy market capacity is expected to be valued at 542.7 Gigawatts (GW) in 2026 and projected to reach 1,245.3 GW by 2033, growing at a CAGR of 12.6% between 2026 and 2033. This exceptional growth trajectory is anchored in the dual forces of federal policy mandates and rapidly declining technology costs. The Inflation Reduction Act (IRA) of 2022 allocated over US$ 369 billion for clean energy investment, creating the most substantial policy tailwind in U.S. energy history.
Utility-scale solar and onshore wind have reached grid parity or below in most U.S. regions, making renewable capacity additions economically superior to new fossil fuel construction. From a historical baseline of 294.9 GW in 2020, the market has expanded at a CAGR of 10.7% through 2025, validating the accelerating momentum entering the forecast period.
Key Industry Highlights:
- Leading Zone: The West U.S. leads the national renewable energy market with approximately 35% of total installed capacity in 2026, underpinned by California's SB 100 mandate, exceptional solar resources, and the nation's largest battery storage fleet.
- Fast-growing Zone: The Southeast U.S. is the fastest-growing region, driven by surging utility-scale solar deployments in Florida, Georgia, and North Carolina, and supported by major utility decarbonization commitments and offshore wind pipeline development.
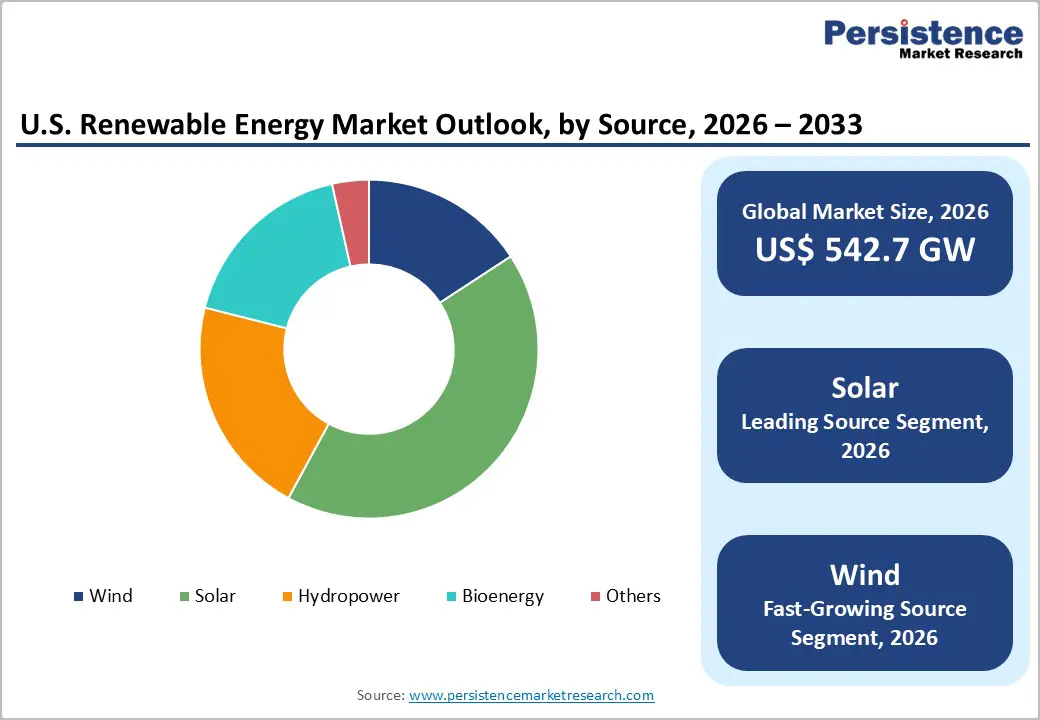
- Dominant Source: Solar energy commands approximately 48% of U.S. renewable capacity share in 2026, reinforced by record annual installations, plummeting PV module costs, and strong policy support from both federal IRA incentives and state-level net metering frameworks.
- Fast-Growing Source: Wind energy is the fastest-growing source at a 13% CAGR (2026 - 2033), driven by offshore wind leasing along Atlantic and Pacific coasts and next-generation turbine technology enabling higher capacity factors in lower-wind regions.
- Key Opportunity: Green hydrogen production powered by renewable electricity, supported by US$ 7 billion in federal H2Hub funding and the IRA's Section 45V tax credit, presents a transformative demand driver for large-scale wind and solar project development through 2033.
DRO Analysis
Drivers - Federal Policy Support and the Inflation Reduction Act
The Inflation Reduction Act (IRA) represents a generational shift in U.S. clean energy policy, providing extended and expanded tax credits for solar, wind, battery storage, and green hydrogen. The Production Tax Credit (PTC) and Investment Tax Credit (ITC) have been extended through at least 2032, offering developers up to 30% base credit with bonus adders for domestic content, energy communities, and low-income areas.
According to the Lawrence Berkeley National Laboratory, annual renewable capacity additions in the U.S. are expected to double relative to pre-IRA baselines. This fiscal certainty has unlocked a wave of manufacturing investments, with over US$ 100 billion in new domestic clean energy manufacturing commitments announced since the IRA's enactment, creating a self-reinforcing cycle of supply chain development and accelerating deployment.
Rapidly Declining Levelized Cost of Energy (LCOE) for Renewables
The economic competitiveness of renewable energy has reached a historic inflection point. According to Lazard's Levelized Cost of Energy Analysis, the unsubsidized LCOE of utility-scale solar PV fell by over 90% between 2009 and 2023, reaching as low as US$ 24 per MWh. Onshore wind costs similarly declined to US$ 27-73 per MWh, well below the cost of new coal (US$ 68-166 per MWh) or gas peaker plants.
The U.S. Energy Information Administration (EIA) projects that renewables will account for nearly 44% of U.S. electricity generation by 2030, up from approximately 21% in 2022, driven by this sustained cost advantage and improving grid integration capabilities.
Restraints - Grid Infrastructure Constraints and Interconnection Backlogs
The rapid acceleration of renewable project development has overwhelmed existing grid interconnection processes. According to the Lawrence Berkeley National Laboratory, the U.S. interconnection queue held over 2,600 GW of proposed projects as of late 2023, nearly twice the existing installed U.S. generation capacity, with average wait times exceeding 5 years.
Transmission network upgrades required to carry renewable power from resource-rich regions to demand centers are estimated to require hundreds of billions of dollars and face complex multi-jurisdictional permitting challenges, creating a significant structural bottleneck to capacity additions.
Supply Chain Vulnerabilities and Critical Mineral Dependencies
U.S. renewable energy manufacturing remains heavily exposed to global supply chain disruptions, particularly for solar panels, wind turbine components, and battery storage systems. The U.S. Department of Energy (DOE) has identified over 50 critical minerals essential to clean energy technologies, many of which are concentrated in geopolitically sensitive regions.
Import tariffs on Chinese-manufactured solar cells and panels, currently up to 50% under recent trade rulings, have contributed to project delays and cost increases, moderating near-term deployment rates, particularly in the solar segment.
Opportunities
Offshore Wind Development Along U.S. Coastlines
Offshore wind represents one of the most substantial capacity expansion opportunities in the U.S. renewable energy landscape. The Bureau of Ocean Energy Management (BOEM) has leased over 20 million acres of U.S. Outer Continental Shelf for offshore wind development, with a federal target of 30 GW of installed offshore wind capacity by 2030 and 110 GW by 2050. Coastal states, including New York, New Jersey, Massachusetts, and California, have enacted aggressive offshore mandates totaling over 80 GW combined.
Floating offshore wind technology, currently being pioneered off the California coast, is set to unlock deep-water sites previously inaccessible to fixed-bottom turbines, potentially multiplying the addressable resource base and driving a new wave of project development through the forecast horizon.
Green Hydrogen and Long-Duration Energy Storage Integration
The rapid scaling of renewable generation capacity is creating co-investment opportunities in complementary technologies, most notably green hydrogen production and long-duration energy storage (LDES). The U.S. Department of Energy's Hydrogen Shot Initiative targets green hydrogen production costs below US$ 1 per kilogram by 2031 (from current levels above US$ 5/kg), while the IRA's Section 45V Clean Hydrogen Production Tax Credit provides up to US$ 3/kg incentive.
Seven federally funded Regional Clean Hydrogen Hubs (H2Hubs) have been awarded US$ 7 billion across the U.S., directly stimulating demand for large-scale renewable power generation to supply electrolyzers, creating high-value, long-term offtake agreements that improve project economics for wind and solar developers.
Category-wise Analysis
Source Insights
Solar energy is the dominant source in the U.S. renewable energy market, commanding approximately 48% of installed renewable capacity in 2026. This leadership position reflects the dramatic cost reductions in photovoltaic (PV) technology over the past decade and the scalability of solar across utility, commercial, and residential applications. According to the Solar Energy Industries Association (SEIA), the U.S. installed a record 32.4 GW of solar capacity in 2023 alone.
The proliferation of large-scale solar farms, particularly in the Southwest and Southeast U.S., combined with robust rooftop solar adoption driven by net metering policies and declining module prices, continues to reinforce solar's market-leading position. The EIA solar project will remain the fastest-deploying source through 2026 before wind begins to close the gap.
Application Insights
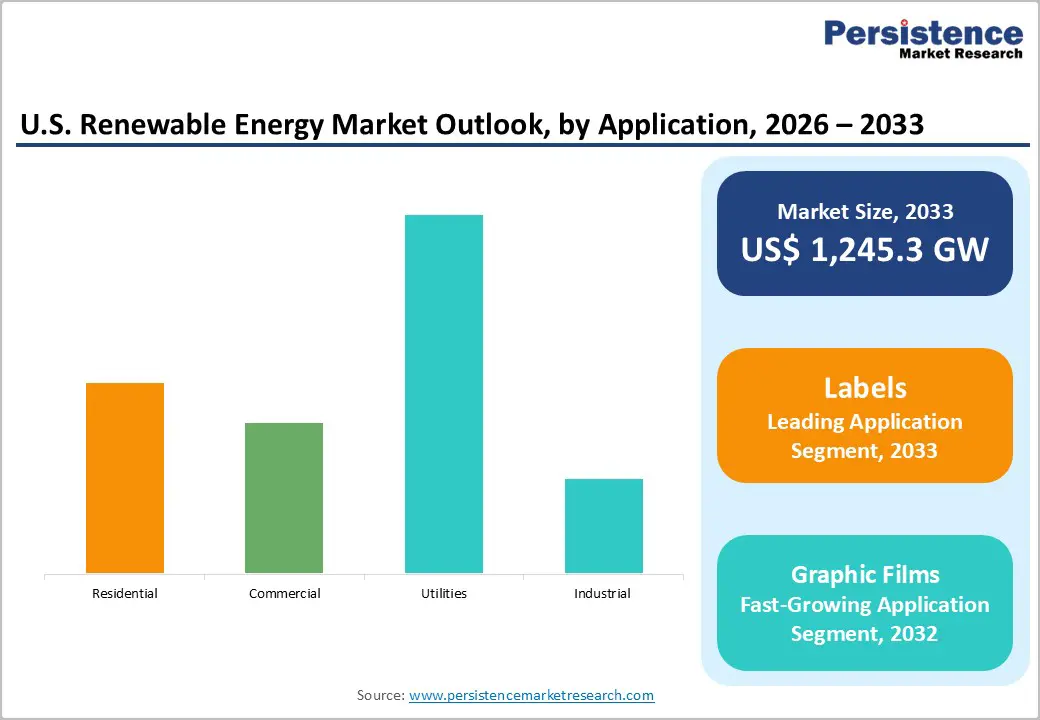
Utilities represent the leading application segment, accounting for approximately 45% of total U.S. renewable energy capacity in 2026. Utility-scale power plants, encompassing large wind farms, solar arrays, and hydroelectric facilities, constitute the foundational layer of renewable energy deployment, driven by state Renewable Portfolio Standards (RPS) mandating that utilities source a defined percentage of power from renewables.
As of 2024, 30 U.S. states plus the District of Columbia have binding RPS requirements, creating assured procurement volumes for utility-scale projects. Corporate Power Purchase Agreements (PPAs) from industrial offtakers, including technology giants such as Amazon, Google, and Microsoft, have further accelerated utility-scale development, with corporates signing a record 46.7 GW of clean energy PPAs globally in 2023.
Regional Analysis
West U.S. Renewable Energy Market Trends and Insights
The West U.S. is the leading renewable energy region, driven by exceptional solar irradiance across California, Nevada, and Arizona, and significant wind resources in Washington and Oregon. California's SB 100 mandates 100% clean electricity by 2045, anchoring long-term demand. The region leads U.S. battery storage deployment, addressing solar intermittency and supporting grid reliability.
Southeast U.S. Renewable Energy Market Trends and Insights
The Southeast U.S. is emerging as the fastest-growing renewable energy region, propelled by aggressive solar deployment across Florida, Georgia, North Carolina, and Texas. The region benefits from high solar isolation and rapidly expanding utility-scale solar farms supported by Duke Energy's and other utilities' carbon transition plans. Offshore wind development along the Southeastern Atlantic seaboard adds a new capacity dimension through the forecast period.
Midwest U.S. Renewable Energy Market Trends and Insights
The Midwest U.S., often referred to as the 'Wind Belt', is a critical hub for onshore wind energy, with states such as Iowa, Kansas, Oklahoma, and Minnesota hosting some of the nation's highest-capacity wind farms. The region's flat terrain, strong wind resources, and established transmission corridors support continued wind capacity additions. Emerging agrivoltaic solar projects are diversifying the Midwest's renewable portfolio.
Competitive Landscape
The U.S. renewable energy market is moderately consolidated among the top tier but remains competitive across project development, manufacturing, and services segments. Market leaders, including NextEra Energy, Constellation Energy, and Invenergy, differentiate through large project pipelines, proprietary grid management technology, and long-duration PPA portfolios.
Key strategic trends include vertical integration into battery storage and green hydrogen, geographic expansion into the Southeast and offshore wind markets, and aggressive pursuit of IRA incentive stacking. Emerging business models encompass community solar subscriptions, virtual power plants (VPPs), and behind-the-meter energy-as-a-service offerings targeting commercial and residential customers.
Key Developments
- In February 2025, NextEra Energy announced a US$ 3.5 billion expansion of its U.S. solar and battery storage pipeline, targeting over 10 GW of new capacity additions through 2027 across Sun Belt states.
- In October 2024, First Solar, Inc. commenced operations at its fourth U.S. manufacturing facility in Louisiana, adding 3.5 GW of annual thin-film panel production capacity and bolstering domestic supply chains under IRA requirements.
- In March 2025, Enphase Energy launched its fifth-generation IQ Battery system with enhanced AI-based energy management, targeting residential customers seeking greater grid independence amid rising utility electricity rates.
Companies Covered in U.S. Renewable Energy Market
- NextEra Energy, Inc.
- Constellation Energy
- Invenergy
- Enel Green Power North America
- Cypress Creek Renewables
- First Solar, Inc.
- Clearway Energy
- Brookfield Renewable U.S.
- Vistra Energy Corp.
- Enphase Energy
- Duke Energy
- Pattern Energy
- Iberdrola USA (Avangrid)
- Arevon Energy
- Sunrun Inc.
Frequently Asked Questions
The U.S. renewable energy market is estimated at 542.7 GW of installed capacity in 2026, up from 294.9 GW in 2020. The market is forecast to reach 1,245.3 GW by 2033 at a CAGR of 12.6%, representing an incremental capacity addition of 702.6 GW over the forecast period, driven by federal IRA incentives and rapidly declining renewable technology costs.
The primary demand drivers are the federal Inflation Reduction Act (IRA)'s extended clean energy tax credits (ITC/PTC through 2032), the dramatic decline in solar and wind LCOE, solar now as low as US$ 24/MWh unsubsidized, and binding state Renewable Portfolio Standards (RPS) in 30 states plus Washington D.C. These policies and economic forces collectively ensure sustained investment in new renewable capacity across the forecast period.
The West U.S. leads the market with approximately 35% of total national renewable capacity in 2026. California alone is the nation's largest renewable energy state, accounting for significant solar and offshore wind investment. The state's SB 100 clean electricity mandate and world-leading battery storage deployment firmly anchor the West's regional dominance.
Offshore wind development and the green hydrogen economy represent the two most transformative opportunities. BOEM has leased over 20 million acres for offshore wind, with a federal target of 30 GW by 2030. Simultaneously, US$ 7 billion in federal H2Hub funding is creating durable renewable power demand for green hydrogen electrolysis, offering developers long-term, bankable offtake agreements.
The market is served by a mix of diversified utilities, independent power producers, and technology-focused developers. Key players include NextEra Energy, Constellation Energy, Invenergy, First Solar, Clearway Energy, Brookfield Renewable U.S., Duke Energy, Enphase Energy, Vistra Energy, Sunrun Inc., and Iberdrola USA (Avangrid).


