


- Specialty & Fine Chemicals
- North America Specialty Solvents Market
North America Specialty Solvents Market Size, Share, and Growth Forecast, 2025 - 2032
North America Specialty Solvents Market by Product Type (Alcohol, Chlorinated Solvents, Aliphatic Hydrocarbon, Amine, Aromatic Hydrocarbon, Chelating Agents, Ester, Ether, Fatty Chemicals, and Ketone), Application (Paints and Coating, Pharmaceuticals & Personal Care, Agriculture, Others) and Regional Analysis for 2025 - 2032
North America Specialty Solvents Market Size and Trends Analysis
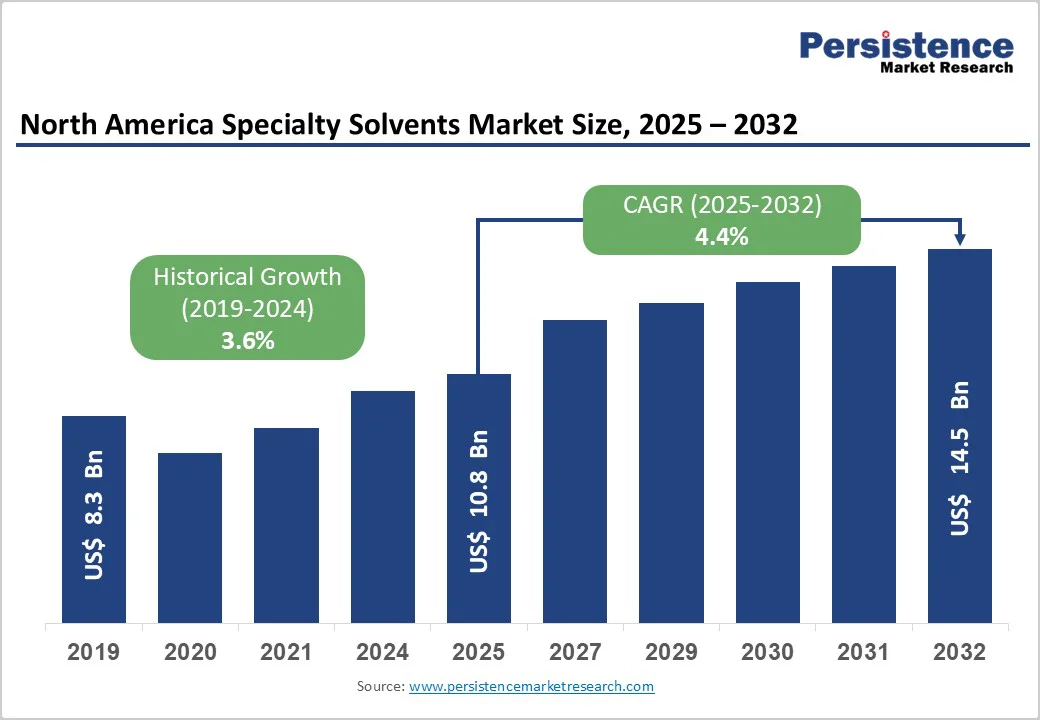
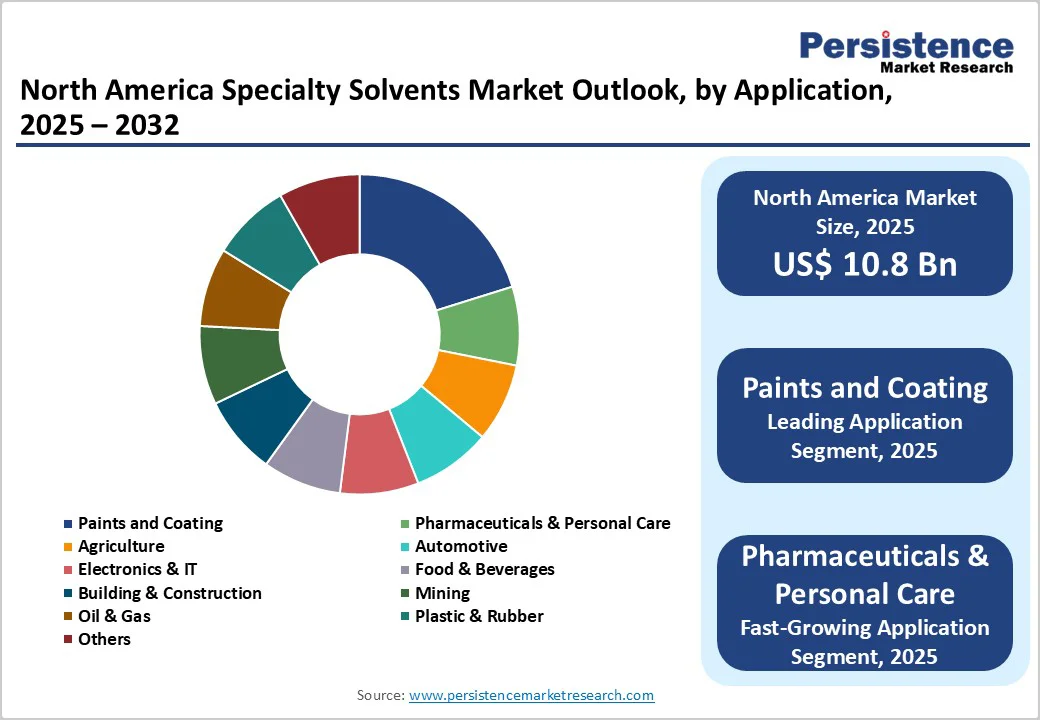
The North American specialty solvents market is valued at US$10.8 billion in 2025 and is projected to reach US$14.5 billion, growing at a CAGR of 4.4% during the forecast period 2025 - 2032.
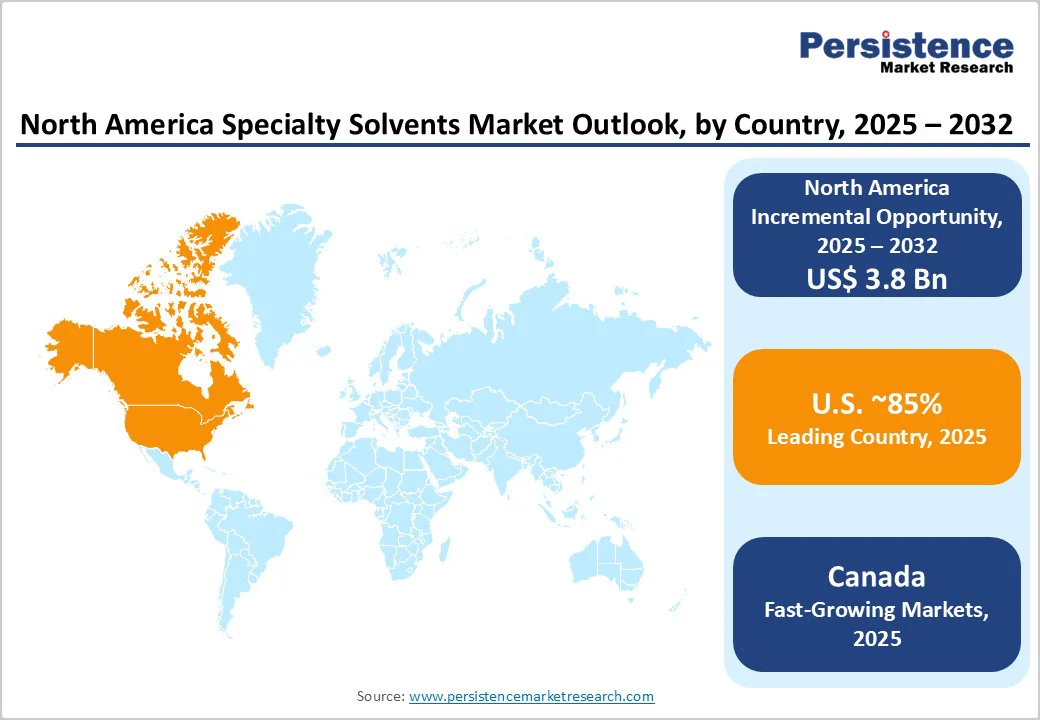
The market's trajectory demonstrates the chemical industry's resilience and the critical role specialty solvents play as essential intermediates in advanced manufacturing processes. Strong demand from the electronics and IT sectors, combined with regulatory pressures favoring safer chemical alternatives, continues to drive market expansion throughout North America, with the U.S. market accounting for approximately 85% of total revenue share.
Key Industry Highlights:
- Rising Food Demand Drives Specialty Solvents Adoption: Global food production must increase by 70% by 2050 to meet population growth, pushing farmers toward Specialty Solvents technologies that boost yields by 15-30% and reduce input waste by 20-25%.
- Pharmaceutical & Personal Care Expansion: Rapid growth in pharmaceutical manufacturing and personal care production is a primary demand catalyst, driven by aging demographics and rising health awareness.
- Premium Pharmaceutical-Grade Solvents: High-purity solvents meeting ICH and FDA standards command premium prices, boosting overall market value despite lower volumes.
- Stringent Environmental Regulations: Tightening VOC and hazardous air pollutant standards by the EPA and state agencies are accelerating the shift toward low-toxicity specialty solvents.
- Supply Chain Challenges: Specialized handling, storage, and transport requirements create cost and distribution constraints, especially for smaller regional manufacturers.
- Innovation in High-Performance Solvents: Manufacturers are developing next-generation ultra-pure solvents for semiconductors, electronics, and pharmaceutical synthesis, enabling higher margins.
- Product Type Insights: Alcohol-based solvents dominate with over 45% market share, supported by wide industrial use and strong safety profiles, while chlorinated solvents grow fastest in niche industrial applications.
- Application Leadership: The paints and coatings segment leads with over 30% revenue share, driven by construction, automotive, and infrastructure activities.
- Country Insights: The U.S. dominates with advanced manufacturing infrastructure and strong regulatory frameworks, while Canada holds a 15% share supported by green chemistry initiatives.
- Competitive Landscape: The market is oligopolistic-BASF and Dow Inc. together control 35-40% of revenue, with Eastman, AkzoNobel, and LyondellBasell as strong secondary players.
| Key Insights | Details |
|---|---|
| Specialty Solvents Market Size (2025E) | US$ 10.8 Bn |
| Market Value Forecast (2032F) | US$ 14.5 Bn |
| Projected Growth (CAGR 2025 to 2032) | 4.4% |
| Historical Market Growth (CAGR 2019 to 2024) | 3.6% |
Market Dynamics
Drivers - Surge in Pharmaceutical and Personal Care Industry Demand
The pharmaceutical and personal care industries represent significant growth catalysts for the North America specialty solvents market. These sectors require high-purity solvents with stringent quality specifications for drug synthesis, formulation development, and stability testing.
The aging North American population, projected to exceed 80 million individuals aged 65 and above by 2030, is driving substantial increases in pharmaceutical consumption, creating sustained demand for pharmaceutical-grade solvents. Specialty solvents serve critical functions, including drug dissolution, extraction processes, and formulation stabilization.
Additionally, the personal care industry's expansion, driven by rising consumer awareness regarding hygiene and wellness products, has increased solvent consumption in cosmetics, skincare formulations, and personal hygiene applications.
Market research indicates that pharmaceutical-grade solvents command premium pricing due to their enhanced purity specifications and regulatory compliance, contributing disproportionately to market value despite moderate volume growth.
Stringent Environmental Regulations Promoting Specialty Solvent Adoption
Federal and state-level environmental regulations in North America continue to tighten restrictions on volatile organic compound (VOC) emissions and hazardous air pollutants. The EPA's comprehensive VOC regulatory framework, codified in 40 CFR 59, establishes application-specific emissions standards for products including architectural coatings, aerosol coatings, and consumer products. These regulatory pressures incentivize manufacturers to adopt specialty solvents with lower volatility and reduced toxicity profiles compared to conventional alternatives.
Regulatory compliance requirements impose operational costs on manufacturers using traditional solvents, thereby creating economic incentives for transition to specialty solvent formulations that meet stricter emissions standards. Many states, including California and Maryland, have implemented VOC limits more restrictively than federal standards, further accelerating specialty solvent adoption among manufacturers seeking nationwide compliance pathways
Restraint - Supply Chain Complexity and Distribution Channel Constraints
The North American specialty solvents market faces structural challenges related to supply chain fragmentation and distribution channel inefficiencies. Specialty solvents require specialized handling, storage facilities meeting safety standards, and specialized transportation infrastructure due to their chemical properties and regulatory classifications. Distribution network limitations in certain geographic regions, particularly in rural areas, constrain market penetration and increase operational costs.
Supply chain vulnerabilities, exposed during the COVID-19 pandemic, have created persistent uncertainties affecting inventory management and pricing stability. Logistical constraints in transporting hazardous chemicals increase distribution costs, which are particularly burdensome for smaller manufacturers with limited geographic reach.
Opportunity - High-Performance Solvent Development for Specialized Applications
Innovation opportunities exist in developing next-generation solvents tailored for emerging applications, including advanced electronics manufacturing, energy storage systems, and specialized pharmaceutical synthesis. Recent product launches exemplify this trend.
Eastman's July 2024 introduction of high-purity electronic grade isopropyl alcohol (IPA) specifically targets semiconductor manufacturers' stringent quality requirements. The development of ultra-pure solvents meeting exacting specifications for semiconductor, microelectronics, and pharmaceutical applications commands significant price premiums and supports differentiation strategies.
North America Specialty Solvents Market Insights and Trends
Product Type Insights
The alcohol segment, encompassing methanol, ethanol, isopropanol, and specialty alcohols, leads the North American specialty solvents market with an estimated 45%+ revenue share. Its dominance stems from broad versatility across pharmaceuticals, coatings, cleaning, and personal care applications, supported by a strong safety profile, regulatory acceptance, and well-established production infrastructure.
Alcohol-based solvents face relatively lower regulatory restrictions and enjoy consistent demand from paints and coatings, which consume nearly 30% of total specialty solvent volumes. The pharmaceutical industry further enhances segment value, as high-purity alcohols command premium pricing to meet stringent compliance standards.
Although the market shows a mature growth trajectory with a CAGR of around 3.6% through 2025, specific subtypes like isopropyl alcohol for electronics applications are experiencing faster expansion than commodity ethanol grades.
Meanwhile, chlorinated solvents represent the market’s fastest-growing product category. Compounds such as perchloroethylene and trichloroethylene remain indispensable in dry cleaning, decreasing, and advanced chemical manufacturing. Despite environmental and toxicity concerns, their superior solvency performance sustains adoption in niche industrial and pharmaceutical synthesis applications.
Application Insights
The paints and coatings segment holds a dominant position in the North American specialty solvents market, accounting for over 30% of total revenue. This leadership reflects the essential role of specialty solvents in dissolving resins, controlling viscosity, and enhancing application properties across industrial, automotive, architectural, and protective coatings.
Demand is further reinforced by U.S. construction growth, rising automotive production, and infrastructure investments. In addition, evolving VOC emission regulations are pushing manufacturers toward advanced, performance-optimized solvents that maintain coating quality while ensuring compliance.
The growing adoption of electric vehicles also fuels demand for specialized coatings in battery protection and adhesive systems, positioning the coatings segment as a mature yet innovation-driven market focused on low-VOC and high-performance formulations.
Conversely, the pharmaceuticals and personal care segment emerges as the fastest-growing application area, driven by pharmaceutical expansion, healthcare consumption, and rising demand for premium personal care products.
Pharmaceutical-grade solvents command premium pricing due to their high purity and compliance with ICH and FDA standards, supporting significant value contribution despite lower volumes. Growth in cosmetics, skincare, and hygiene products, alongside increasing disposable incomes and consumer awareness, ensures that this segment continues to outpace others in both innovation and revenue growth potential.
Country wise Insights and Trends
U.S dominates specialty solvents due to its advanced industries, robust infrastructure, and strong regulatory framework.
The U.S. market dominance reflects multiple structural advantages, including the world's largest pharmaceutical industry, advanced electronics manufacturing infrastructure, and a mature coatings and specialty chemicals manufacturing sector. The U.S. market benefits from established chemical supply chains, sophisticated distribution networks, and a highly developed ecosystem of specialty chemical manufacturers.
The region's regulatory framework, while stringent, has established clear compliance pathways enabling manufacturers to optimize product portfolios for U.S. market requirements. Dominant market players, including BASF, Dow Inc., and Eastman Chemical Company, maintain significant manufacturing capacity throughout the United States, particularly in the Gulf Coast petrochemical complex and other strategic manufacturing hubs.
The U.S. market exhibits mature market characteristics with steady demand growth driven by underlying economic activity in end-use sectors. Recent developments including Eastman's July 2024 EastaPure IPA product launch and BASF's April 2024 introduction of dispersing agent technology demonstrate continued innovation among market leaders.
Regulatory compliance requirements for VOC emissions and hazardous air pollutant limitations incentivize manufacturers to adopt specialty solvents, creating structural demand growth independent of overall economic expansion.
Canada’s Specialty Solvents Market Grows Steadily with 15% Share, Driven by Pharma Expansion and Green Manufacturing Initiatives
Canada represents a secondary North American market with approximately 15% regional share, exhibiting steady growth driven by pharmaceutical industry expansion and manufacturing sector development. The Canadian market benefits from regulatory harmonization with U.S. EPA standards, enabling manufacturers to serve both markets with coordinated product strategies.
Canadian environmental regulations, enforced by Environment and Climate Change Canada (ECCC), emphasize VOC reduction and hazardous substance management, creating demand for specialty solvents with improved environmental profiles.
The Canadian market exhibits particular strength in pharmaceuticals, food processing, and personal care manufacturing sectors. Government initiatives promoting green chemistry and sustainable manufacturing practices encourage the adoption of bio-based and environmentally friendly specialty solvents.
Investment in pharmaceutical manufacturing capacity in Canada, particularly for generic drug production and specialty pharmaceutical formulations, creates sustained solvent demand growth.
Competitive Landscape
The North American specialty solvents market exhibits an oligopolistic market structure with significant concentration among multinational chemical manufacturers. BASF and Dow Inc. represent the two dominant manufacturers, together controlling approximately 35-40% of market revenue.
These market leaders leverage global scale economies, extensive R&D capabilities, and diversified product portfolios to maintain a competitive advantage. Eastman Chemical Company, AkzoNobel, LyondellBasell Industries, and Shell Chemicals represent secondary players with a collective approximately 25-30% market share, while regional manufacturers and specialized producers occupy the remaining market segments.
The market demonstrates moderate-to-high barriers to entry, including substantial capital requirements for specialty chemical manufacturing facilities, regulatory compliance infrastructure, and safety systems.
Supply chain integration advantages favor larger players with established distribution networks and customer relationships. Innovation capability and R&D investment represent critical competitive requirements, with successful players maintaining dedicated research teams focused on next-generation solvent development.
Key Industry Developments
- In 2024, Eastman expanded its EastaPure solvents portfolio with the launch of high-purity electronic grade isopropyl alcohol (IPA) targeting semiconductor manufacturers.
- In 2024, BASF introduced Efka PX 4360, a dispersing agent for solvent-based industrial coatings utilizing Controlled Free Radical Polymerization technology.
- In 2024, AkzoNobel introduced the ESP-950 2K solvent-borne primer for automotive OEM exterior plastic parts, addressing specific adhesion challenges on complex substrate compositions.
Companies Covered in North America Specialty Solvents Market
- BASF SE.
- Bayer Group.
- AkzoNobel N.V.
- The Dow Chemical Company.
- LyondellBasell Industries Holdings B.V.
- Mitsui Chemicals.
- Evonik Industries
- Huntsman International LLC
- Celanese Corporation
- Braskem SA.
- PPG Industries.
- Other Market Players
Frequently Asked Questions
The North America Specialty Solvents market is estimated to be valued at US$ 10.8 Bn in 2025.
The key demand driver for the North America Specialty Solvents market is the increasing demand from high-value end-use industries such as paints and coatings, pharmaceuticals, and personal care, where specialty solvents play a critical role in enhancing product performance, formulation stability, and compliance with evolving environmental regulations.
In 2025, the U.S. will dominate the market with an exceeding 85% revenue share in the North America Specialty Solvents market.
Among application, Paints and coatings have the highest preference, capturing beyond 30% of the market revenue share in 2025, surpassing other applications.
Key players in the North America Specialty Solvents market include BASF SE, Bayer Group, AkzoNobel N.V., The Dow Chemical Company, LyondellBasell Industries Holdings B.V., and Mitsui Chemicals, all of which maintain strong regional operations and diverse product portfolios focused on high-performance, low-VOC, and bio-based solvent technologies serving industries such as paints and coatings, pharmaceuticals, automotive, and personal care.


