

1. Executive Summary
1.1. Global Mixed Reality Market Snapshot, 2025 and 2032
1.2. Market Opportunity Assessment, 2025 – 2032, US$ Bn
1.3. Key Market Trends
1.4. Future Market Projections
1.5. Premium Market Insights
1.6. Industry Developments and Key Market Events
1.7. PMR Analysis and Recommendations
2. Market Overview
2.1. Market Scope and Definition
2.2. Market Dynamics
2.2.1. Drivers
2.2.2. Restraints
2.2.3. Opportunity
2.2.4. Challenges
2.2.5. Key Trends
2.3. Macro-Economic Factors
2.3.1. Global Sectorial Outlook
2.3.2. Global GDP Growth Outlook
2.3.3. Other Macro-economic Factors
2.4. COVID-19 Impact Analysis
2.5. Forecast Factors – Relevance and Impact
2.6. Regulatory Landscape
2.7. Value Chain Analysis
2.7.1. List of Service Manufacturers
2.7.2. List of Service Distributors
2.7.3. List of End Users
2.8. PESTLE Analysis
2.9. Porter’s Five Force Analysis
3. Price Trend Analysis, 2019 – 2032
3.1. Key Highlights
3.2. Key Factors Impacting Service Prices
3.3. Pricing Analysis, By Component
3.4. Regional Prices and Historical and Future Growth Trends
4. Global Mixed Reality Market Outlook: Historical (2019 – 2023) and Forecast (2025 – 2032)
4.1. Key Highlights
4.1.1. Market Volume (Units) Projections
4.1.2. Market Size (US$ Bn) and Y-o-Y Growth
4.1.3. Absolute $ Opportunity
4.2. Market Size (US$ Bn) Analysis and Forecast
4.2.1. Historical Market Size (US$ Bn) Analysis, 2019-2023
4.2.2. Current Market Size (US$ Bn) Analysis and Forecast, 2025–2032
4.3. Global Mixed Reality Market Outlook: Service
4.3.1. Introduction / Key Findings
4.3.2. Historical Market Size (US$ Bn) Analysis, By Component, 2019-2023
4.3.3. Current Market Size (US$ Bn) Analysis and Forecast, By Component, 2025 – 2032
4.3.3.1. Hardware
4.3.3.2. Software
4.4. Market Attractiveness Analysis: Service
4.5. Global Mixed Reality Market Outlook: Device Type
4.5.1. Introduction / Key Findings
4.5.2. Historical Market Size (US$ Bn) Analysis, By Device Type, 2019-2023
4.5.3. Current Market Size (US$ Bn) Analysis and Forecast, By Device Type, 2025 – 2032
4.5.3.1. Wired
4.5.3.2. Wireless
4.6. Market Attractiveness Analysis: Application
4.7. Global Mixed Reality Market Outlook: Application
4.7.1. Introduction / Key Findings
4.7.2. Historical Market Size (US$ Bn) Analysis, By Application, 2019-2023
4.7.3. Current Market Size (US$ Bn) Analysis and Forecast, By Application, 2025 – 2032
4.7.3.1. Aerospace and Defense
4.7.3.2. Automotive
4.7.3.3. E-commerce and Retail
4.7.3.4. Aerospace and Defense
4.7.3.5. Education
4.7.3.6. Industrial and Manufacturing
4.7.3.7. Architecture
4.7.3.8. Entertainment and Gaming
4.7.3.9. Medical
4.7.3.10. Others
4.8. Market Attractiveness Analysis: Application
5. Global Mixed Reality Market Outlook: Region
5.1. Key Highlights
5.2. Historical Market Size (US$ Bn) Analysis, By Region, 2019-2023
5.3. Current Market Size (US$ Bn) Analysis and Forecast, By Region, 2025 – 2032
5.3.1. North America
5.3.2. Europe
5.3.3. East Asia
5.3.4. South Asia and Oceania
5.3.5. Latin America
5.3.6. Middle East & Africa
5.4. Market Attractiveness Analysis: Region
6. North America Mixed Reality Market Outlook: Historical (2019 – 2023) and Forecast (2025 – 2032)
6.1. Key Highlights
6.2. Pricing Analysis
6.3. Historical Market Size (US$ Bn) Analysis, By Market, 2019-2023
6.3.1. By Country
6.3.2. By Component
6.3.3. By Enterprise Size
6.3.4. By Device Type
6.4. Current Market Size (US$ Bn) Analysis and Forecast, By Country, 2025 – 2032
6.4.1. U.S.
6.4.2. Canada
6.5. Current Market Size (US$ Bn) Analysis and Forecast, By Component, 2025 – 2032
6.5.1. Hardware
6.5.2. Software
6.6. Current Market Size (US$ Bn) Analysis and Forecast, By Application 2025 – 2032
6.6.1. Aerospace and Defence
6.6.2. Automotive
6.6.3. Ecommerce and Retail
6.6.4. Aerospace and Defense
6.6.5. Education
6.6.6. Industrial and Manufacturing
6.6.7. Architecture
6.6.8. Entertainment and Gaming
6.6.9. Medical
6.6.10. Others
6.7. Current Market Size (US$ Bn) Analysis and Forecast, By Device Type, 2025 – 2032
6.7.1. Wired
6.7.2. Wireless
6.8. Market Attractiveness Analysis
7. Europe Mixed Reality Market Outlook: Historical (2019 – 2023) and Forecast (2025 – 2032)
7.1. Key Highlights
7.2. Pricing Analysis
7.3. Historical Market Size (US$ Bn) Analysis, By Market, 2019-2023
7.3.1. By Country
7.3.2. By Component
7.3.3. By Enterprise Size
7.3.4. By Device Type
7.4. Current Market Size (US$ Bn) Analysis and Forecast, By Country, 2025 – 2032
7.4.1. Germany
7.4.2. France
7.4.3. U.K.
7.4.4. Italy
7.4.5. Spain
7.4.6. Russia
7.4.7. Türkiye
7.4.8. Rest of Europe
7.5. Current Market Size (US$ Bn) Analysis and Forecast, By Component, 2025 – 2032
7.5.1. Hardware
7.5.2. Software
7.6. Current Market Size (US$ Bn) Analysis and Forecast, By Application 2025 – 2032
7.6.1. Aerospace and Defence
7.6.2. Automotive
7.6.3. Ecommerce and Retail
7.6.4. Aerospace and Defense
7.6.5. Education
7.6.6. Industrial and Manufacturing
7.6.7. Architecture
7.6.8. Entertainment and Gaming
7.6.9. Medical
7.6.10. Others
7.7. Current Market Size (US$ Bn) Analysis and Forecast, By Device Type, 2025 – 2032
7.7.1. Wired
7.7.2. Wireless
7.8. Market Attractiveness Analysis
8. East Asia Mixed Reality Market Outlook: Historical (2019 – 2023) and Forecast (2025 – 2032)
8.1. Key Highlights
8.2. Pricing Analysis
8.3. Historical Market Size (US$ Bn) Analysis, By Market, 2019-2023
8.3.1. By Country
8.3.2. By Component
8.3.3. By Enterprise Size
8.3.4. By Device Type
8.4. Current Market Size (US$ Bn) Analysis and Forecast, By Country, 2025 – 2032
8.4.1. China
8.4.2. Japan
8.4.3. South Korea
8.5. Current Market Size (US$ Bn) Analysis and Forecast, By Component, 2025 – 2032
8.5.1. Hardware
8.5.2. Software
8.6. Current Market Size (US$ Bn) Analysis and Forecast, By Application 2025 – 2032
8.6.1. Aerospace and Defence
8.6.2. Automotive
8.6.3. Ecommerce and Retail
8.6.4. Aerospace and Defense
8.6.5. Education
8.6.6. Industrial and Manufacturing
8.6.7. Architecture
8.6.8. Entertainment and Gaming
8.6.9. Medical
8.6.10. Others
8.7. Current Market Size (US$ Bn) Analysis and Forecast, By Device Type, 2025 – 2032
8.7.1. Wired
8.7.2. Wireless
8.8. Market Attractiveness Analysis
9. South Asia & Oceania Mixed Reality Market Outlook: Historical (2019 – 2023) and Forecast (2025 – 2032)
9.1. Key Highlights
9.2. Pricing Analysis
9.3. Historical Market Size (US$ Bn) Analysis, By Market, 2019-2023
9.3.1. By Country
9.3.2. By Component
9.3.3. By Enterprise Size
9.3.4. By Device Type
9.4. Current Market Size (US$ Bn) Analysis and Forecast, By Country, 2025 – 2032
9.4.1. India
9.4.2. Southeast Asia
9.4.3. ANZ
9.4.4. Rest of South Asia & Oceania
9.5. Current Market Size (US$ Bn) Analysis and Forecast, By Component, 2025 – 2032
9.5.1. Hardware
9.5.2. Software
9.6. Current Market Size (US$ Bn) Analysis and Forecast, By Application 2025 – 2032
9.6.1. Aerospace and Defence
9.6.2. Automotive
9.6.3. Ecommerce and Retail
9.6.4. Aerospace and Defense
9.6.5. Education
9.6.6. Industrial and Manufacturing
9.6.7. Architecture
9.6.8. Entertainment and Gaming
9.6.9. Medical
9.6.10. Others
9.7. Current Market Size (US$ Bn) Analysis and Forecast, By Device Type, 2025 – 2032
9.7.1. Wired
9.7.2. Wireless
9.8. Market Attractiveness Analysis
10. Latin America Mixed Reality Market Outlook: Historical (2019 – 2023) and Forecast (2025 – 2032)
10.1. Key Highlights
10.2. Pricing Analysis
10.3. Historical Market Size (US$ Bn) Analysis, By Market, 2019-2023
10.3.1. By Country
10.3.2. By Component
10.3.3. By Device Type
10.3.4. By Age Group
10.4. Current Market Size (US$ Bn) Analysis and Forecast, By Country, 2025 – 2032
10.4.1. Brazil
10.4.2. Mexico
10.4.3. Rest of Latin America
10.5. Current Market Size (US$ Bn) Analysis and Forecast, By Component, 2025 – 2032
10.5.1. Hardware
10.5.2. Software
10.6. Current Market Size (US$ Bn) Analysis and Forecast, By Application 2025 – 2032
10.6.1. Aerospace and Defence
10.6.2. Automotive
10.6.3. Ecommerce and Retail
10.6.4. Aerospace and Defense
10.6.5. Education
10.6.6. Industrial and Manufacturing
10.6.7. Architecture
10.6.8. Entertainment and Gaming
10.6.9. Medical
10.6.10. Others
10.7. Current Market Size (US$ Bn) Analysis and Forecast, By Device Type, 2025 – 2032
10.7.1. Wired
10.7.2. Wireless
10.8. Market Attractiveness Analysis
11. Middle East & Africa Mixed Reality Market Outlook: Historical (2019 – 2023) and Forecast (2025 – 2032)
11.1. Key Highlights
11.2. Pricing Analysis
11.3. Historical Market Size (US$ Bn) Analysis, By Market, 2019-2023
11.3.1. By Country
11.3.2. By Component
11.3.3. By Enterprise Size
11.3.4. By Device Type
11.4. Current Market Size (US$ Bn) Analysis and Forecast, By Component, 2025 – 2032
11.4.1. Hardware
11.4.2. Software
11.5. Current Market Size (US$ Bn) Analysis and Forecast, By Application 2025 – 2032
11.5.1. Aerospace and Defence
11.5.2. Automotive
11.5.3. Ecommerce and Retail
11.5.4. Aerospace and Defense
11.5.5. Education
11.5.6. Industrial and Manufacturing
11.5.7. Architecture
11.5.8. Entertainment and Gaming
11.5.9. Medical
11.5.10. Others
11.6. Current Market Size (US$ Bn) Analysis and Forecast, By Device Type, 2025 – 2032
11.6.1. Wired
11.6.2. Wireless
11.7. Market Attractiveness Analysis
12. Competition Landscape
12.1. Market Share Analysis, 2023
12.2. Market Structure
12.2.1. Competition Intensity Mapping By Market
12.2.2. Competition Dashboard
12.3. Company Profiles (Details – Overview, Financials, Strategy, Recent Developments)
12.3.1. HTC Corporation
12.3.1.1. Overview
12.3.1.2. Segments and Services
12.3.1.3. Key Financials
12.3.1.4. Market Developments
12.3.1.5. Market Strategy
12.3.2. Intel Corporation
12.3.3. Magic Leap, Inc.
12.3.4. Microsoft Corporation
12.3.5. Facebook
12.3.6. Eon Reality Inc.
12.3.7. Google Inc.
12.3.8. Samsung Electronics Co. Ltd.
12.3.9. Seiko Epson Corporation
12.3.10. Meta Company
12.3.11. Accenture PLC
12.3.12. Sony Corporation
12.3.13. HP Development Company LP
12.3.14. Dell Technologies Inc.
12.3.15. Amber Garage
12.3.16. Occipital Inc.
13. Appendix
13.1. Research Methodology
13.2. Research Assumptions
13.3. Acronyms and Abbreviations


- Media & Entertainment
- Mixed Reality Market
Mixed Reality Market Size, Share, and Growth Forecast from 2025 - 2032
Mixed Reality Market by Component (Hardware, Software), Device Type (Wired, Wireless), Application (Aerospace and Defense, Automotive, E-commerce and Retail, Aerospace and Defense, Education), and Regional Analysis from 2025 to 2032
Mixed Reality Market Size and Share Analysis
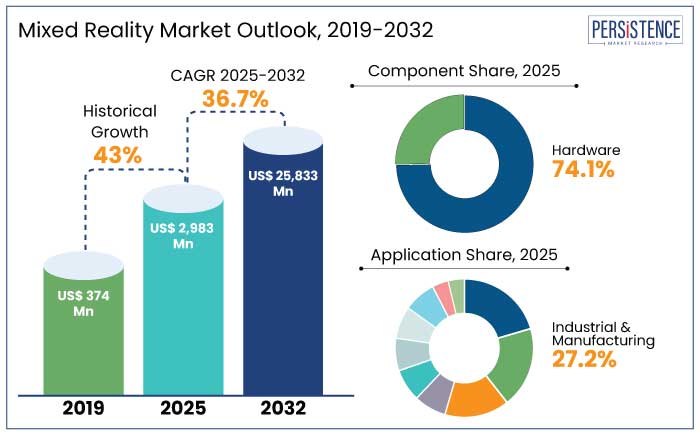
The global mixed reality market is predicted to reach a size of US$ 2983 Mn by 2025. It is anticipated to witness a CAGR of 36.7% during the forecast period to attain a value of US$ 25833 Mn by 2032.
Mixed Reality (MR) is estimated to transform assembly lines, maintenance, and training programs. By 2030, industrial applications are predicted to account for 25% of the global MR industry. The technology is anticipated to play a pivotal role in medical training, surgery simulations, and patient care.
Immersive learning platforms are projected to gain traction, especially in emerging markets. Education applications are predicted to represent 15% of the market by 2032, owing to rising adoption in schools and universities.
Key Highlights of the Industry
- Integration of AI into MR platforms will likely enable personalized experiences, novel object recognition, and natural language processing.
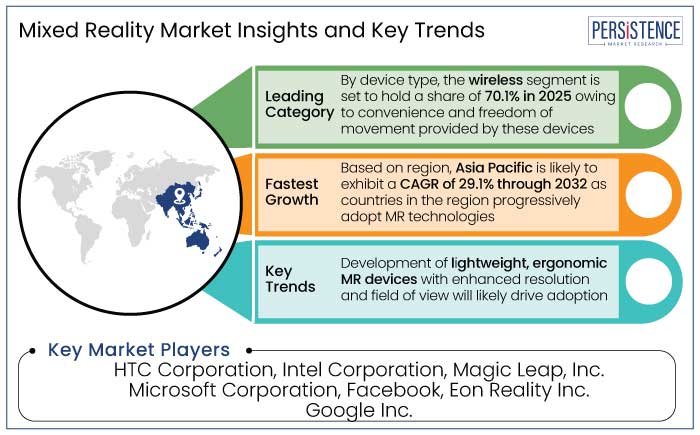
- Development of lightweight, ergonomic MR devices with enhanced resolution and field of view is set to augment adoption.
- Cloud computing is anticipated to enable MR applications to run on lightweight devices, decreasing dependency on high-cost hardware.
- In retail and e-commerce, virtual try-ons, showroom experiences, and interactive shopping will likely be leading use cases.
- MR glasses are projected to dominate consumer markets, with companies like Apple, Meta, and Microsoft leading the way.
- MR is anticipated to redefine gaming, offering immersive and interactive experiences.
- By component, the hardware segment is set to hold a share of 74.1% in 2025 as it assists in delivering immersive experiences.
- Based on application, the industrial and manufacturing segment is predicted to hold a share of 27.2% in 2025 as MR enables real time collaborations.
- In terms of device type, the wireless segment is projected to hold a share of 70.1% in 2025 owing to its high convenience.
- Mixed reality market in Asia Pacific is set to exhibit a CAGR of 29.1% through 2032 owing to rising adoption of MR technologies across cross sectors.
|
Market Attributes |
Key Insights |
|
Mixed Reality Market Size (2025E) |
US$ 2983 Mn |
|
Projected Market Value (2032F) |
US$ 25833 Mn |
|
Global Market Growth Rate (CAGR 2025 to 2032) |
36.7% |
|
Historical Market Growth Rate (CAGR 2019 to 2023) |
43% |
Asia Pacific to Showcase Robust Growth Owing to its Tech Savvy Population
Asia Pacific mixed reality industry is anticipated to emerge as the leading region with a share of 38.2% in 2025. Growth in the region is highly driven by the increasing adoption of MR technologies across various sectors, including healthcare, education, manufacturing, and entertainment.
China’s developments in technology, coupled with large-scale investments in MR for industries such as entertainment, education, and healthcare, play a key role in driving the market. The growing technology sector in India along with an increased adoption of MR in education and healthcare and government initiatives further contribute to the industry’s growth.
Japan's robust technological infrastructure and high demand for MR applications in manufacturing, automotive, and healthcare contribute to expansion. With a large and tech-savvy population, Asia Pacific has witnessed a robust consumer demand for immersive technologies like mixed reality. Young and tech-savvy consumers in urban areas, particularly in China, Japan, and South Korea, are driving the growth of MR applications in gaming, entertainment, and social media.
Hardware Devices are Set to be Essential for Delivering Immersive Experiences
Hardware is anticipated to hold a share of 74.1% in 2025. The segment is experiencing significant growth as demand for MR headsets, smart glasses, and other wearables continues to rise. These devices are essential for delivering immersive experiences in mixed reality.
Growth is driven by increasing use of MR hardware in various sectors such as entertainment, healthcare, education, and industrial applications. The development of unique MR headsets, such as Microsoft’s HoloLens, Magic Leap, and Oculus Quest, is crucial to the growth of the MR market. These devices combine augmented reality (AR) and virtual reality (VR) technologies, providing users with a fully immersive experience. Their enhanced features like improved field of view, faster processing speeds, and better comfort, have driven their adoption across businesses and consumer markets.
The demand for MR smart glasses is also increasing, particularly in enterprise applications. Companies like Vuzix and Google are developing lightweight, wearable MR solutions that are being used for hands-free tasks, such as maintenance, logistics, and healthcare.
MR to Allow Real Time Remote Collaboration in Industrial and Manufacturing Sector
Industrial and manufacturing is estimated to hold a share of 27.2% in 2025. MR technologies enable manufacturers to visualize, simulate, and optimize their operations, leading to increased efficiency and decreased errors. MR is being used extensively for training employees in a safe and risk-free environment.
In the industrial sector, workers can practice complex tasks using MR headsets without the need for physical prototypes or expensive machinery, thereby decreasing training costs and time. MR enables real-time remote collaboration between factory workers and experts. With MR glasses or headsets, workers can receive on-the-spot guidance from specialists, decreasing downtime and increasing productivity.
Rapid growth of MR in this sector is due to its ability to streamline processes and improve operational efficiency. Manufacturers use MR for predictive maintenance, asset management, and repair operations. With MR headsets, technicians can access real-time data and step-by-step instructions overlaid on equipment, improving the speed and accuracy of repairs.
Wireless Devices are Preferred as they Provide Users with Greater Freedom of Movement
Wireless device type is anticipated to hold a share of 70.1% in 2025. Wireless MR headsets eliminate the need for physical connections, providing users with greater freedom of movement. This is particularly important in applications like gaming, training, and industrial simulations where mobility enhances realism. For instance,
- Meta Quest 2 and Pico 4 are fully wireless, offering a cable-free experience.
- By 2025, 80% of MR devices sold are set to be wireless, highlighting a shift from the previous dominance of wired headsets.
The roll-out of 5G networks and the adoption of Wi-Fi 6 have dramatically improved the bandwidth, latency, and stability of wireless connections. This has enabled wireless MR devices to deliver high-quality experiences previously only possible with wired solutions. 5G connectivity provides low-latency and high-speed data transfer, which is crucial for real-time MR applications. For example,
- By 2027, 5G-enabled MR headsets are set to make up 40% of the global MR market, contributing to the growth of wireless devices.
As consumer preference shifts toward more convenient and user-friendly devices, wireless MR headsets have gained popularity. They allow for quicker setup times and better comfort compared to wired alternatives. Consumer electronics brands, including Meta and HTC, have prioritized the development of wireless MR devices to meet demand.
Mixed Reality Market Introduction and Trend Analysis
Potential growth in the global mixed reality market is predicted to be driven by MR applications in urban planning, virtual tourism, ecommerce, and telemedicine. Countries including China, Japan, and the U.S. are investing in MR technologies for defense, smart cities, and educational purposes.
Innovations in MR headsets, smart glasses, and wearables are estimated to decline costs, thereby making MR accessible to small businesses and consumers. Mixed reality is anticipated to become integral for training, remote collaboration, and product design, especially in manufacturing and healthcare.
Historical Growth and Course Ahead
The mixed reality market growth was robust at a CAGR of 43% during the historical period. This growth was primarily driven by early adopters in gaming, entertainment, and enterprise applications like training and simulation. The COVID-19 pandemic accelerated the adoption of MR technologies as businesses sought remote collaboration tools and immersive solutions for training and education.
Increasing investments in MR hardware and software helped the market to reach around US$ 3 Bn, showing continued momentum in industries like healthcare, education, and retail. The gaming and entertainment industries drove demand for immersive content, particularly in countries with strong digital ecosystems like the U.S., China, and Japan.
The forecast period is anticipated to integrate AI and 5G, thereby enhancing MR capabilities, providing faster, immersive, and personalized experiences. Falling costs of MR hardware are likely to make the technology accessible to small and medium-sized businesses and individual consumers.
Market Growth Drivers
Focus on Urban Planning and Smart Cities to Boost Demand
By 2030, 60% of smart cities worldwide are projected to integrate MR technologies into their urban planning processes. MR enables architects, urban planners, and engineers to create and interact with 3D models of urban projects. This enables better planning, design accuracy, and identification of potential issues before construction begins. For instance,
- A study revealed that MR can decrease infrastructure planning errors by 30% to 40%, saving billions in construction costs annually.
MR applications assist governments and urban planners to communicate complex projects to the public in an engaging and visual format. Surveys show that MR-based public engagement can increase community understanding and project approval by 50%.
MR aids in managing and maintaining city infrastructure like roads, bridges, and public utilities by providing real-time visual data overlays. For instance,
- By 2030, MR-based infrastructure management solutions are likely to save cities up to 20% in annual maintenance costs.
Surging Development of the Gaming Industry to Push Demand
The consumer market is increasingly adopting lightweight, user-friendly MR wearables such as smart glasses, MR headsets, and contact lenses. For instance,
- Meta's Quest line and Apple's Vision Pro are leading consumer devices that integrate MR features for gaming, entertainment, and productivity.
MR is transforming the gaming industry by enabling immersive experiences where physical and virtual worlds merge. For instance,
- MR games like Pokemon Go and upcoming MR-based MMORPGs (Massively Multiplayer Online Role-Playing Games) provide interactive gameplay in real-world environments.
Virtual concerts, MR-enabled movie theaters, and interactive storytelling are growing trends in the entertainment sector.
- MR entertainment experiences are projected to attract over 50 million active users globally by 2030.
MR-enabled fitness solutions, such as virtual workout classes and immersive exercise routines, are becoming popular among consumers. Companies like Peloton are integrating MR into home workout systems for enhanced engagement.
Market Restraining Factors
Complexity in Development and Integration May Hinder Demand
Developing MR applications require expertise in multiple new technologies including 3D modelling, AI and ML, and real-time data processing. Companies struggle to find skilled developers, resulting in longer development cycles and higher costs. For example,
- A 2023 survey revealed that 70% of businesses cited a lack of skilled MR developers as a barrier to adoption.
Development of MR applications involves substantial investments in software tools, skilled professionals, and testing. Small and medium-sized enterprises (SMEs) find it difficult to afford custom MR solutions.
- The average cost of developing an MR application has risen by 20% between 2020 and 2023.
The lack of standardization across MR hardware and software platforms complicates integration. Different MR devices (Microsoft HoloLens and Meta Quest Pro) often require tailored applications, creating fragmentation. Businesses face challenges in developing applications that work seamlessly across multiple devices.
- Over 50% of MR developers report difficulties in ensuring cross-platform compatibility.
Market Growth Opportunities
Demand for Defense and Public Safety Applications to Skyrocket
MR enables realistic, immersive training for military personnel, simulating combat scenarios, equipment handling, and tactical maneuvers. The U.S. Army uses MR for soldier training through programs like the Integrated Visual Augmentation System (IVAS), which overlays tactical data on the user's field of view. For example,
- MR-based training reduces costs by 30% compared to traditional training methods while improving retention and performance.
MR creates virtual battlefields where soldiers can train for urban combat, disaster response, and mission rehearsals without physical deployments. It also assists in mission planning by allowing commanders to visualize terrains, analyze tactical options, and simulate operational outcomes in real-time.
MR-enabled systems provide 3D maps of conflict zones, helping strategists identify potential threats and optimize troop movements. MR further enhances mission accuracy by 25% to 30%, reducing the risk to personnel and resources.
MR to be Integrated into Virtual Classrooms and Student Orientations
MR brings subjects like history, science, and geography to life, enabling students to explore virtual environments and 3D models. Students can explore ancient ruins, the human anatomy, or the solar system in an immersive environment. For example,
- Studies show a 35% improvement in knowledge retention when MR is used in classrooms compared to traditional teaching methods.
MR also enables virtual classrooms where students can interact with instructors and peers in a shared virtual space. Universities are adopting MR for virtual campus tours, student orientation, and collaborative research projects. Medical students use MR to simulate surgeries, gaining hands-on experience in a risk-free environment.
MR-enhanced medical training can improve procedural accuracy by 45%. Fields like architecture, engineering, and arts benefit from MR tools as it enables students to visualize and manipulate 3D designs. For instance,
- By 2032, around 30% of higher education institutions globally are set to integrate MR into their curricula.
Competitive Landscape for the Mixed Reality Market
Companies in the mixed reality market are developing cutting-edge hardware like unique headsets, wearables, and sensors to enhance user experience. They are also creating powerful software platforms and applications to support immersive MR experiences for various industries like healthcare, education, entertainment, and manufacturing.
Businesses are further collaborating with tech giants, start-ups, and industry leaders to leverage complementary expertise. For instance, partnerships with cloud service providers assist in delivering more scalable MR solutions. They are teaming up with content creators, developers, and companies across various sectors to build tailored MR applications.
Brands are continuously investing in research and development activities to enhance the realism, interactivity, and usability of MR experiences. This includes developments in AI, machine learning, computer vision, and haptic feedback. Manufacturers are also enhancing the integration of MR with other technologies like AI and 5G for faster, more immersive experiences.
Recent Industry Developments
- In January 2025, Sony launched a new brand dedicated to XR products at CES 2025 under the name of XYN.
- In January 2025, Kosé Corporation debuted a beauty tech innovation, a Mixed Reality Makeup system, at CES 2025 which projects realistic looking makeup on the face.
- In January 2025, LG announced a strategic partnership with Microsoft to shape the future of AI powered spaces at CES 2025, aiming to combine LG’s diverse product range with Microsoft’s unique AI technology to create ‘empathetic AI integrated services.’
- In December 2024, Google and Samsung revealed Project Moohan mixed reality headset and Android XR, quoting it to be the ‘first platform built entirely for the Gemini era.’
- In June 2024, Dish TV formed a strategic collaboration with Flam and announced the launch of a innovative mixed reality (MR) experience.
- In April 2024, Meta announced that it would be opening its Meta Horizon OS mixed reality OS to third party hardware manufacturers, enabling other companies to create VR headsets powered by the same platform that runs Meta Quest Devices.
- In March 2024, Fresenius Medical Care announced the launch of AR which will focus on training for kidney replacement therapy devices.
- In January 2024, Qualcomm announced that Snapdragon XR2+ Gen 2 chip which can be used in VR and AR.
Companies Covered in Mixed Reality Market
- HTC Corporation
- Intel Corporation
- Magic Leap, Inc.
- Microsoft Corporation
- Eon Reality Inc.
- Google Inc.
- Samsung Electronics Co. Ltd.
- Seiko Epson Corporation
- Meta Company
- Accenture PLC
- Sony Corporation
- HP Development Company LP
- Dell Technologies Inc.
- Amber Garage
- Occipital Inc.
Frequently Asked Questions
The market is anticipated to reach a value of US$ 25833 Mn by 2032.
In a mixed reality experience, a digital object like a book can be anchored to a specific location in the real world, say by a bedside table.
Mixed reality is used in applications including design, education, entertainment, military training, healthcare, and human-in-the-loop operation of robots.
Prominent players in the market include HTC Corporation, Intel Corporation, and Magic Leap, Inc.
The market is predicted to witness a CAGR of 36.7% throughout the forecast period.


