

- Executive Summary
- Global F2/N2 Gas Mixture Market Snapshot 2026 and 2033
- Market Opportunity Assessment, 2026 - 2033, US$ Bn
- Key Market Trends
- Industry Developments and Key Market Events
- Demand Side and Supply Side Analysis
- PMR Analysis and Recommendations
- Market Overview
- Market Scope and Definitions
- Value Chain Analysis
- Macro-Economic Factors
- Global GDP Outlook
- Global Semiconductor Industry Overview
- Global Automotive Industry Overview
- Global Chemical Industry Overview
- Forecast Factors - Relevance and Impact
- COVID-19 Impact Assessment
- PESTLE Analysis
- Porter's Five Forces Analysis
- Geopolitical Tensions: Market Impact
- Regulatory and Technology Landscape
- Market Dynamics
- Drivers
- Restraints
- Opportunities
- Trends
- Price Trend Analysis, 2020 - 2033
- Region-wise Price Analysis
- Price by Segments
- Price Impact Factors
- Global F2/N2 Gas Mixture Market Outlook: Historical (2020 - 2025) and Forecast (2026 - 2033)
- Key Highlights
- Global F2/N2 Gas Mixture Market Outlook: Product Type
- Introduction/Key Findings
- Historical Market Size (US$ Bn) and Volume (Tons) Analysis by Product Type, 2020-2025
- Current Market Size (US$ Bn) and Volume (Tons) Forecast, by Product Type, 2026-2033
- 10%F2N2
- 20%F2N2
- Market Attractiveness Analysis: Product Type
- Global F2/N2 Gas Mixture Market Outlook: Distribution Channel
- Introduction/Key Findings
- Historical Market Size (US$ Bn) and Volume (Tons) Analysis by Distribution Channel, 2020-2025
- Current Market Size (US$ Bn) and Volume (Tons) Forecast, by Distribution Channel, 2026-2033
- Direct Sales
- Distributors & Resellers
- Online B2B Platforms
- Market Attractiveness Analysis: Distribution Channel
- Global F2/N2 Gas Mixture Market Outlook: End-Use
- Introduction/Key Findings
- Historical Market Size (US$ Bn) and Volume (Tons) Analysis by End-Use , 2020-2025
- Current Market Size (US$ Bn) and Volume (Tons) Forecast, by End-Use , 2026-2033
- Semiconductor & Electronics
- Chemical Manufacturing
- Glass & Ceramics
- Automotive
- Aerospace & Defense
- Research Institutions
- Others
- Market Attractiveness Analysis: End-Use
- Global F2/N2 Gas Mixture Market Outlook: Region
- Key Highlights
- Historical Market Size (US$ Bn) and Volume (Tons) Analysis by Region, 2020-2025
- Current Market Size (US$ Bn) and Volume (Tons) Forecast, by Region, 2026-2033
- North America
- Europe
- East Asia
- South Asia & Oceania
- Latin America
- Middle East & Africa
- Market Attractiveness Analysis: Region
- North America F2/N2 Gas Mixture Market Outlook: Historical (2020 - 2025) and Forecast (2026 - 2033)
- Key Highlights
- Pricing Analysis
- North America Market Size (US$ Bn) and Volume (Tons) Forecast, by Country, 2026-2033
- U.S.
- Canada
- North America Market Size (US$ Bn) and Volume (Tons) Forecast, by Product Type, 2026-2033
- 10%F2N2
- 20%F2N2
- North America Market Size (US$ Bn) and Volume (Tons) Forecast, by Distribution Channel, 2026-2033
- Direct Sales
- Distributors & Resellers
- Online B2B Platforms
- North America Market Size (US$ Bn) and Volume (Tons) Forecast, by End-Use , 2026-2033
- Semiconductor & Electronics
- Chemical Manufacturing
- Glass & Ceramics
- Automotive
- Aerospace & Defense
- Research Institutions
- Others
- Europe F2/N2 Gas Mixture Market Outlook: Historical (2020 - 2025) and Forecast (2026 - 2033)
- Key Highlights
- Pricing Analysis
- Europe Market Size (US$ Bn) and Volume (Tons) Forecast, by Country, 2026-2033
- Germany
- Italy
- France
- U.K.
- Spain
- Russia
- Rest of Europe
- Europe Market Size (US$ Bn) and Volume (Tons) Forecast, by Product Type, 2026-2033
- 10%F2N2
- 20%F2N2
- Europe Market Size (US$ Bn) and Volume (Tons) Forecast, by Distribution Channel, 2026-2033
- Direct Sales
- Distributors & Resellers
- Online B2B Platforms
- Europe Market Size (US$ Bn) and Volume (Tons) Forecast, by End-Use , 2026-2033
- Semiconductor & Electronics
- Chemical Manufacturing
- Glass & Ceramics
- Automotive
- Aerospace & Defense
- Research Institutions
- Others
- East Asia F2/N2 Gas Mixture Market Outlook: Historical (2020 - 2025) and Forecast (2026 - 2033)
- Key Highlights
- Pricing Analysis
- East Asia Market Size (US$ Bn) and Volume (Tons) Forecast, by Country, 2026-2033
- China
- Japan
- South Korea
- East Asia Market Size (US$ Bn) and Volume (Tons) Forecast, by Product Type, 2026-2033
- 10%F2N2
- 20%F2N2
- East Asia Market Size (US$ Bn) and Volume (Tons) Forecast, by Distribution Channel, 2026-2033
- Direct Sales
- Distributors & Resellers
- Online B2B Platforms
- East Asia Market Size (US$ Bn) and Volume (Tons) Forecast, by End-Use , 2026-2033
- Semiconductor & Electronics
- Chemical Manufacturing
- Glass & Ceramics
- Automotive
- Aerospace & Defense
- Research Institutions
- Others
- South Asia & Oceania F2/N2 Gas Mixture Market Outlook: Historical (2020 - 2025) and Forecast (2026 - 2033)
- Key Highlights
- Pricing Analysis
- South Asia & Oceania Market Size (US$ Bn) and Volume (Tons) Forecast, by Country, 2026-2033
- India
- Southeast Asia
- ANZ
- Rest of SAO
- South Asia & Oceania Market Size (US$ Bn) and Volume (Tons) Forecast, by Product Type, 2026-2033
- 10%F2N2
- 20%F2N2
- South Asia & Oceania Market Size (US$ Bn) and Volume (Tons) Forecast, by Distribution Channel, 2026-2033
- Direct Sales
- Distributors & Resellers
- Online B2B Platforms
- South Asia & Oceania Market Size (US$ Bn) and Volume (Tons) Forecast, by End-Use , 2026-2033
- Semiconductor & Electronics
- Chemical Manufacturing
- Glass & Ceramics
- Automotive
- Aerospace & Defense
- Research Institutions
- Others
- Latin America F2/N2 Gas Mixture Market Outlook: Historical (2020 - 2025) and Forecast (2026 - 2033)
- Key Highlights
- Pricing Analysis
- Latin America Market Size (US$ Bn) and Volume (Tons) Forecast, by Country, 2026-2033
- Brazil
- Mexico
- Rest of LATAM
- Latin America Market Size (US$ Bn) and Volume (Tons) Forecast, by Product Type, 2026-2033
- 10%F2N2
- 20%F2N2
- Latin America Market Size (US$ Bn) and Volume (Tons) Forecast, by Distribution Channel, 2026-2033
- Direct Sales
- Distributors & Resellers
- Online B2B Platforms
- Latin America Market Size (US$ Bn) and Volume (Tons) Forecast, by End-Use , 2026-2033
- Semiconductor & Electronics
- Chemical Manufacturing
- Glass & Ceramics
- Automotive
- Aerospace & Defense
- Research Institutions
- Others
- Middle East & Africa F2/N2 Gas Mixture Market Outlook: Historical (2020 - 2025) and Forecast (2026 - 2033)
- Key Highlights
- Pricing Analysis
- Middle East & Africa Market Size (US$ Bn) and Volume (Tons) Forecast, by Country, 2026-2033
- GCC Countries
- South Africa
- Northern Africa
- Rest of MEA
- Middle East & Africa Market Size (US$ Bn) and Volume (Tons) Forecast, by Product Type, 2026-2033
- 10%F2N2
- 20%F2N2
- Middle East & Africa Market Size (US$ Bn) and Volume (Tons) Forecast, by Distribution Channel, 2026-2033
- Direct Sales
- Distributors & Resellers
- Online B2B Platforms
- Middle East & Africa Market Size (US$ Bn) and Volume (Tons) Forecast, by End-Use , 2026-2033
- Semiconductor & Electronics
- Chemical Manufacturing
- Glass & Ceramics
- Automotive
- Aerospace & Defense
- Research Institutions
- Others
- Competition Landscape
- Market Share Analysis, 2025
- Market Structure
- Competition Intensity Mapping
- Competition Dashboard
- Company Profiles
- The Linde Group
- Company Overview
- Product Portfolio/Offerings
- Key Financials
- SWOT Analysis
- Company Strategy and Key Developments
- Solvay SA
- Versium Materials
- Air Liquide S.A.
- Hyosung Japan Co.,Ltd.
- Ingentec Corp.
- Pelchem SOC Ltd
- Wuxi Yuntong Gas Co., Ltd.
- Messer Group GmbH
- Matheson Tri‑Gas, Inc.
- Hangzhou Hangyang Co., Ltd.
- Central Glass Co., Ltd.
- Others.
- The Linde Group
- Appendix
- Research Methodology
- Research Assumptions
- Acronyms and Abbreviations


- Specialty & Fine Chemicals
- F2/N2 Gas Mixture Market
F2/N2 Gas Mixture Market Size, Share, and Growth Forecast 2026 - 2033
F2/N2 Gas Mixture Market by Product Type (10%F2N2, and 20%F2N2), Distribution Channel (Direct Sales, Distributors & Resellers, Online B2B Platforms), End-user (Semiconductor & Electronics, Chemical Manufacturing, Glass & Ceramics, Automotive, Aerospace & Defense, Research Institutions), and Regional Analysis, 2026 - 2033
F2/N2 Gas Mixture Market Size and Trend Analysis
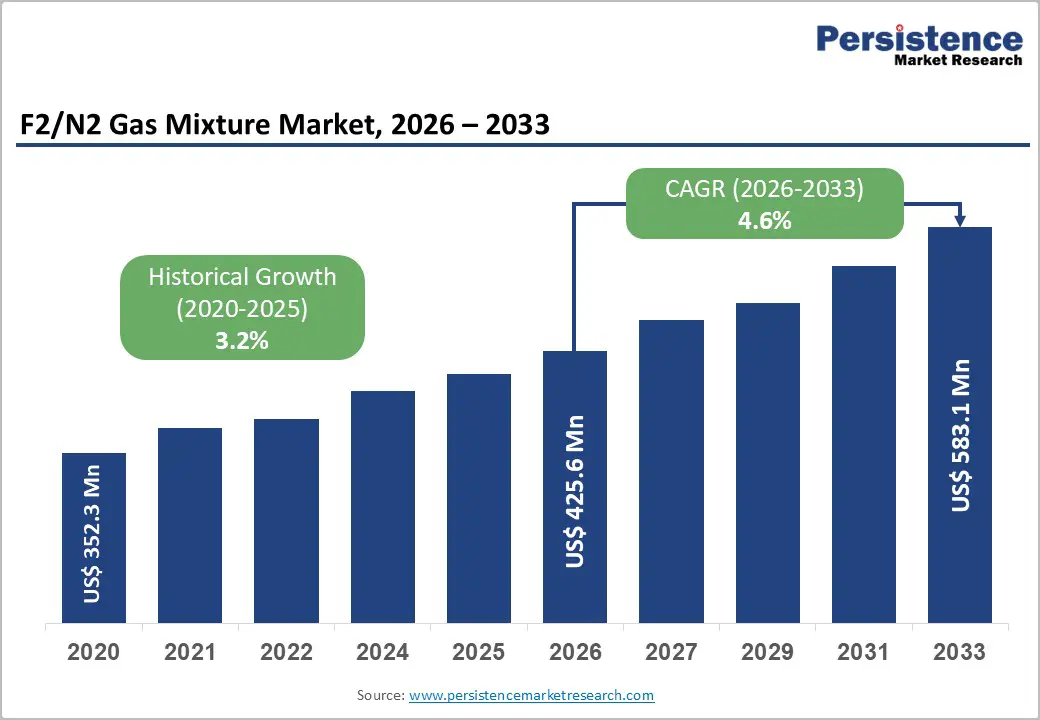
The global F2/N2 gas mixture market size is likely to be valued at US$ 425.6 million in 2026 and is expected to reach US$ 583.1 million by 2033, growing at a CAGR of 4.6% during the forecast period from 2026 to 2033.
Rising demand for ultra-high-purity process gases in semiconductor & electronics manufacturing, coupled with the shift away from high-GWP gases such as NF3 and CF4, is structurally lifting consumption of 10%F2N2 and 20%F2N2 mixtures for chamber cleaning and etching.
Key Industry Highlights:
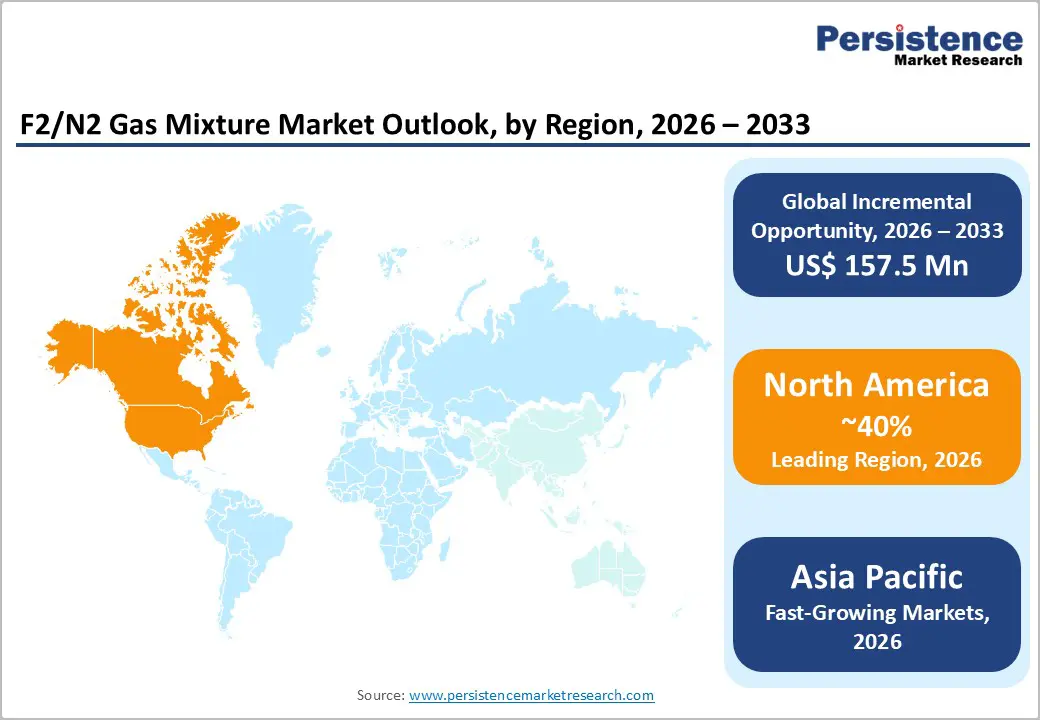
- Leading Region: North America leads the F2/N2 gas mixture market accounting for 40% share, supported by major U.S. semiconductor fab investments, strict safety and environmental regulations, and the presence of global industrial gas majors with advanced electronic-grade fluorine infrastructures and integrated onsite supply solutions.
- Fastest Growing Region: Asia Pacific is the fastest-growing regional market with 5.7% CAGR, driven by dense semiconductor manufacturing in China, Japan, South Korea, and Taiwan, plus growing electronics, glass, and battery manufacturing in India and ASEAN, all adopting 10%F2N2 and 20%F2N2 for advanced processing.
- Dominant Segment: The Semiconductor & Electronics end-user segment holds the largest share, leveraging F2/N2 mixtures for high-efficiency chamber cleaning and etching, improving wafer yields, chamber uptime, and sustainability metrics as fabs transition away from high-GWP gases such as NF3 and C2F6.
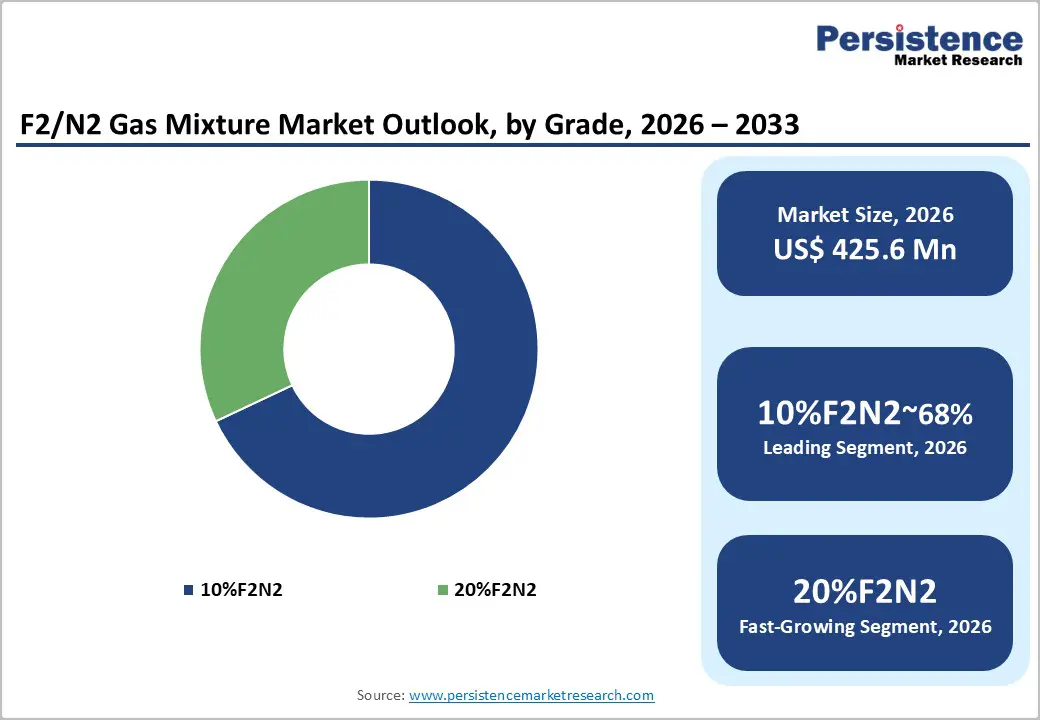
- Fastest Growing Segment: Within product type, 20%F2N2 is the fastest-growing segment, enabled by its superior cleaning rates in 12-inch CVD and etch chambers, zero GWP profile, and growing use in glass processing and advanced surface treatment across automotive, solar, and aerospace applications.
- Key Market Opportunity: Expanding application of 10%F2N2 in continuous-flow fluorination for pharmaceuticals, agrochemicals, and specialty polymers, combined with 20% blends in glass and composite surface treatments, creates high-value, technology-driven growth beyond core semiconductor cleaning use cases.
| Key Insights | Details |
|---|---|
| F2/N2 Gas Mixture Market Size (2026E) | US$ 425.6 Million |
| Market Value Forecast (2033F) | US$ 583.1 Million |
| Projected Growth CAGR (2026 - 2033) | 4.6% |
| Historical Market Growth (2020 - 2025) | 3.2% |
Market Dynamics
Drivers - Shift Toward Zero-GWP Fluorine-Nitrogen Gases Driving Sustainable Fab Operations
A major structural growth driver for the F2/N2 gas mixture market is the global shift away from high-global-warming-potential cleaning gases such as NF3 and C2F6 toward environmentally sustainable alternatives. These traditional gases have extremely high GWPs, creating strong regulatory and corporate pressure to replace them. In response, semiconductor manufacturers are increasingly adopting fluorine-nitrogen (F2/N2) mixtures, which have a zero GWP while delivering equal or superior cleaning performance.
High-purity F2/N2 blends are now widely used for cleaning CVD and etch chambers, efficiently removing silicon oxide and silicon nitride residues. These mixtures also help reduce tool downtime and improve chamber uptime. Leading suppliers such as Solvay and Pelchem SOC Ltd emphasize that F2/N2 gases function as drop-in replacements without requiring major equipment redesign. Their compatibility with advanced process nodes supports sustainability roadmaps across semiconductor fabs in the U.S., Europe, Japan, South Korea, and Taiwan.
Rising Semiconductor Capacity and Equipment Complexity Fueling Cleaning Gas Demand
The continued expansion of global semiconductor manufacturing capacity is a strong driver for rising demand for F2/N2 gas mixtures. Growth in the production of logic, memory, and power semiconductors has significantly increased the number of advanced wafer fabrication facilities worldwide. Modern 300-mm fabs and upgraded 200-mm lines rely on complex multilayer structures and high-aspect-ratio features, which necessitate more frequent and precise chamber cleaning.
As a result, gases such as 10% F2N2 and 20% F2N2 are increasingly used in dry-cleaning cycles. Industry trends show strong growth in spending on CVD, ALD, and advanced etch tools, all of which depend on reliable cleaning gases to maintain yield and operational stability. With large investments underway in North America, Europe, and the Asia Pacific, the installed base of semiconductor tools continues to rise. This directly increases consumption of high-purity fluorine-nitrogen mixtures, making them a standard part of modern semiconductor manufacturing processes.
Restraints - Strict Safety and Infrastructure Requirements Limiting Wider Adoption
Despite strong demand, the market faces challenges due to the hazardous nature of fluorine-containing gas mixtures. F2/N2 is highly oxidizing and corrosive, and fluorine is classified as a toxic compressed gas under international transport regulations. These properties require specialized storage systems, corrosion-resistant materials, dedicated gas cabinets, and advanced leak detection technologies. Industry safety guidelines specify that even low fluorine concentrations must be handled with extreme caution, whereas 10% and 20% mixtures require a fully engineered fluorine-handling infrastructure.
This significantly increases capital expenditure for gas distribution and facility upgrades. In addition, companies must invest in continuous safety training, emergency response systems, and strict operating procedures. These requirements can limit adoption among smaller manufacturers and research facilities. In emerging markets, limited fluorine-handling expertise and evolving regulatory frameworks further increase operational complexity, slowing broader market penetration and increasing overall cost of ownership.
Limited Qualified Suppliers and Lengthy Fab Approval Processes Constraining Supply
The F2/N2 gas mixture market is constrained by a limited number of qualified suppliers capable of meeting semiconductor-grade purity standards. These applications demand extremely low impurity levels, often at sub-ppm thresholds for moisture, oxygen, and particulates. Achieving and maintaining such specifications requires advanced purification systems, robust quality control, and tightly controlled logistics. Additionally, semiconductor fabs require lengthy qualification processes for each gas supplier and formulation, which can take several months.
As a result, only a small group of global players, including Linde, Air Liquide, Messer, Solvay, and Matheson Tri-Gas, dominate the market. This concentration leads to perceived supply-chain risks, longer lead times, and limited pricing flexibility for buyers. For new regional entrants, especially in Latin America and the Middle East & Africa, building comparable ultra-high-purity fluorine supply chains is capital-intensive and technically complex, creating high entry barriers and slowing market expansion.
Opportunity - Emerging Use of 10%F2N2 in Continuous-Flow Fluorination Creating New Chemical Demand
An important growth opportunity for the F2/N2 gas mixture market lies beyond semiconductors, particularly in continuous-flow fluorination used in fine chemical production. The 10%F2N2 blend is gaining attention as a safer and more controllable fluorinating agent compared with pure elemental fluorine. Research and industrial studies indicate that dilute fluorine mixtures improve reaction stability, temperature control, and operator safety, particularly in microreactor and flow chemistry systems. Continuous-flow technology limits reaction volumes and enables real-time monitoring, significantly reducing the risks traditionally associated with fluorine chemistry.
As demand increases for fluorinated pharmaceuticals, agrochemical actives, and specialty intermediates, manufacturers are actively evaluating F2/N2 blends as greener and more efficient alternatives to conventional halogenating agents. Chemical producers in Europe, North America, and Asia Pacific are particularly focused on this approach, creating new high-value applications that expand market demand beyond electronics and into specialty chemical innovation.
Expanding Role of 20%F2N2 in Large-Area Electronics and Advanced Surface Treatment
The use of 20%F2N2 mixtures is expanding steadily across large-area electronics, glass processing, and advanced surface treatment applications. High-concentration fluorine-nitrogen blends offer fast and uniform cleaning performance, making them suitable for large deposition chambers used in display panels and solar manufacturing. Companies such as Linde and Resonac highlight their ability to provide a consistent supply with a lower environmental impact compared with legacy fluorinated gases.
In glass manufacturing, F2/N2 mixtures support controlled surface etching, roughening, and hydrophobic treatments, improving coating adhesion and optical clarity. These properties are valuable in architectural glazing, automotive glass, and specialty ceramics. Additionally, the mixtures are being tested for surface activation in battery components, fuel cell plates, and composite materials used in aerospace and automotive applications. As manufacturers seek advanced surface-engineering solutions, F2/N2 gases are emerging as key enablers of next-generation material performance.
Category-wise Analysis
Product Type Insights
Among product types, 20%F2N2 is expected to hold the leading share of the global F2/N2 gas mixture market, accounting for nearly 60% of total value demand. Its higher fluorine concentration delivers faster and more efficient cleaning performance, making it ideal for advanced semiconductor fabs using 12-inch wafer tools. These high-volume facilities require frequent chamber cleaning to maintain yield stability and process consistency. Suppliers such as Linde and Resonac promote 20%F2N2 as a safer alternative to pure fluorine, offering strong oxidizing power at controlled partial pressures.
At the same time, it provides zero GWP benefits compared with NF3 and other perfluorinated gases. The 10%F2N2 segment, representing around 40% share, continues to see strong demand in laboratories, pilot plants, and continuous-flow chemical systems. Its lower concentration improves safety and controllability, making it suitable for research and specialty chemical applications.
Distribution Channel Insights
Direct sales are expected to remain the dominant distribution channel in the F2/N2 gas mixture market, accounting for approximately 65% of overall demand. Large semiconductor fabs, chemical producers, and glass manufacturers prefer long-term supply contracts with major industrial gas companies such as Air Liquide, Linde, Messer, and Matheson Tri-Gas. These direct relationships allow suppliers to provide customized purity grades, onsite generation systems, cylinder management, and integrated safety engineering support.
Such services are critical when handling highly reactive fluorine-based gases. Distributors and resellers account for roughly 25% of the market, mainly serving smaller fabs, specialty processors, and regional industrial users. Meanwhile, online B2B platforms contribute around 10% share, primarily catering to research institutions and small industrial buyers seeking standardized gas packages. While online procurement improves accessibility, most high-volume users continue to rely on direct supplier partnerships due to safety, reliability, and compliance requirements.
End-user Insights
The semiconductor and electronics industry remains the largest end-user segment, accounting for approximately 55% of total consumption of the F2/N2 gas mixture. High-volume production of logic chips, memory devices, sensors, and power semiconductors requires frequent chamber cleaning to prevent residue buildup and particle contamination. Both 10%F2N2 and 20%F2N2 mixtures enable fast, uniform cleaning while supporting zero-GWP sustainability objectives. Equipment manufacturers report improved chamber uptime, lower defect rates, and stable etch performance when transitioning from NF3 to fluorine-nitrogen gases.
The remaining 45% of demand comes from chemical manufacturing, glass and ceramics, automotive, aerospace and defense, and research institutions. In these sectors, F2/N2 mixtures are used for surface passivation, fluoropolymer synthesis, glass etching, and materials research. As safety expertise improves and standardized handling practices are adopted, adoption across non-semiconductor industries is expected to increase steadily.
Regional Insights
North America F2/N2 Gas Mixture Market Trends
North America is strongly driven by the expanding U.S. semiconductor ecosystem. Government-backed initiatives aimed at reshoring chip manufacturing have accelerated investments in new fabs and equipment across states such as Arizona, Texas, New York, and Ohio. These projects generate sustained demand for high-purity 10%F2N2 and 20%F2N2 mixtures used in chamber cleaning and etching. Major industrial gas suppliers, including Air Liquide, Linde, and Matheson Tri-Gas, are expanding domestic specialty gas production and onsite delivery models to support long-term supply agreements.
Strict regulatory oversight from OSHA, EPA, and local fire authorities emphasizes engineered safety systems, risk assessment, and emergency preparedness. This regulatory environment favors established suppliers with advanced safety technologies. Additionally, robust research activity in semiconductor processing, aerospace materials, and fluorination chemistry reinforces North America’s position as a key hub for innovation and development.
Europe F2/N2 Gas Mixture Market Trends
Europe’s F2/N2 gas mixture market benefits from a combination of advanced manufacturing capabilities and strong environmental regulations. Semiconductor and electronics producers across Germany, France, the U.K., and Spain are increasingly shifting toward low-GWP process gases to align with European Green Deal targets and F-gas regulations. As a result, F2/N2 mixtures are attracting attention as sustainable alternatives to traditional perfluorinated cleaning gases. Leading industrial gas suppliers maintain dense production and distribution networks across the region, ensuring reliable supply to chipmakers, display manufacturers, and specialty glass processors.
Europe’s well-established chemical industry is also exploring 10%F2N2 for continuous-flow fluorination, supported by the region’s leadership in process intensification and flow chemistry. Detailed safety guidelines developed by European gas associations provide clear standards for system design and materials compatibility. These frameworks reduce perceived risk and encourage broader industrial adoption across automotive, aerospace, and advanced materials sectors.
Asia Pacific F2/N2 Gas Mixture Market Trends
Asia-Pacific is expected to experience the fastest growth in the global F2/N2 gas mixture market, owing to its dominant role in semiconductor manufacturing. Countries such as China, Japan, South Korea, and Taiwan host large concentrations of memory and foundry fabs that are major consumers of 20%F2N2 for 300-mm chamber cleaning. At the same time, emerging investments in India and Southeast Asia are expanding regional electronics and materials manufacturing capacity.
Local suppliers, including Hyosung Japan, Wuxi Yuntong Gas, and Hangzhou Hangyang, are strengthening fluorine infrastructure to complement global industrial gas majors. Beyond semiconductors, strong growth in glass, ceramics, solar panels, automotive components, and lithium-ion batteries is creating additional demand for F2/N2 gases. Government initiatives promoting high-value manufacturing and materials innovation further support adoption. As engineering expertise and safety standards mature, the Asia Pacific is well-positioned for above-average long-term market growth.
Competitive Landscape
The F2/N2 gas mixture market is moderately concentrated, dominated by a small group of global industrial gas and specialty chemical companies, alongside regional and niche suppliers. Major players such as Linde, Air Liquide, Messer, Matheson Tri-Gas, and Central Glass compete based on high-purity production capabilities, global logistics networks, and integrated onsite solutions. These companies also differentiate through strong safety engineering expertise and long-term partnerships with semiconductor manufacturers.
Regional players, including Solvay, Pelchem, Wuxi Yuntong Gas, and Ingentec, provide additional depth through localized supply and specialized fluorine chemistries. Key strategic priorities across the industry include expanding electronic-grade gas capacities, localizing production near new fabrication plants, and investing in safer cylinder and valve technologies. Collaboration with equipment manufacturers and end users on process optimization using 10%F2N2 and 20%F2N2 formulations remains a critical competitive advantage in meeting advanced manufacturing requirements.
Key Developments:
- In February, 2023, Pelchem SOC Ltd strengthened its fluorine and F2/N2 gas production infrastructure to better serve semiconductor, chemical, and surface-treatment markets, improving high-purity supply security and enhancing export capacity to meet growing global demand for specialty fluorochemical mixtures.
- In October, 2023, Resonac highlighted its high-purity 20%F2/N2 gas specifically tailored for cleaning film deposition chambers in semiconductor fabs, noting its proven fit with 12-inch CVD systems and advantages over legacy cleaning gases in performance and environmental impact.
Companies Covered in F2/N2 Gas Mixture Market
- The Linde Group
- Solvay SA
- Versum Materials
- Air Liquide S.A.
- Hyosung Japan Co., Ltd.
- Ingentec Corp.
- Pelchem SOC Ltd
- Wuxi Yuntong Gas Co., Ltd.
- Messer Group GmbH
- Matheson Tri-Gas, Inc.
- Hangzhou Hangyang Co., Ltd.
- Central Glass Co., Ltd.
- Others
Frequently Asked Questions
The global F2/N2 Gas Mixture Market is forecast to be valued at around US$ 425.6 Million in 2026 and is expected to reach approximately US$ 583.1 Million by 2033, reflecting a steady 4.6% CAGR driven by semiconductor, chemical, and glass applications.
Key demand drivers include the shift from high-GWP gases like NF3 and C2F6 to zero-GWP F2/N2 mixtures in semiconductor chamber cleaning, increasing wafer fab capacity globally, rising safety-optimized fluorination in continuous-flow chemistry, and expanded use in glass, surface treatment, and advanced materials processing.
By product type, 20%F2N2 is the leading segment due to its strong cleaning and etching performance in 12-inch CVD and etch tools. By end-use, Semiconductor & Electronics dominates, leveraging F2/N2 mixtures for high-efficiency dry chamber cleaning and contamination control across advanced logic, memory, and power device manufacturing.
North America currently dominates the F2/N2 Gas Mixture Market, supported by large-scale U.S. semiconductor investments, stringent occupational and environmental regulations, and deep capabilities of global industrial gas majors providing high-purity fluorine-nitrogen mixtures and integrated safety solutions.
The most promising opportunity lies in extending F2/N2 usage beyond semiconductor fabs into continuous-flow fluorination for pharmaceuticals and agrochemicals, advanced glass and composite surface treatments, and emerging energy applications, where 10%F2N2 and 20%F2N2 enable safer, more sustainable high-performance processes.
Key players include The Linde Group, Solvay SA, Versum Materials, Air Liquide S.A., Hyosung Japan Co., Ltd., Ingentec Corp., Pelchem SOC Ltd, Wuxi Yuntong Gas Co., Ltd., Messer Group GmbH, Matheson Tri-Gas, Inc., Hangzhou Hangyang Co., Ltd., Central Glass Co., Ltd., and other regional fluorine mixture specialists supplying high-purity 10%F2N2 and 20%F2N2 products globally.


